Heads up! To view this whole video, sign in with your Courses account or enroll in your free 7-day trial. Sign In Enroll
Well done!
You have completed Data Visualization with Google Sheets!
You have completed Data Visualization with Google Sheets!
A geographic chart is a map where data can be plotted at different locations across the world. It represents the data as a map to give a more accurate insight into the location of the data.
Example Geo Charts
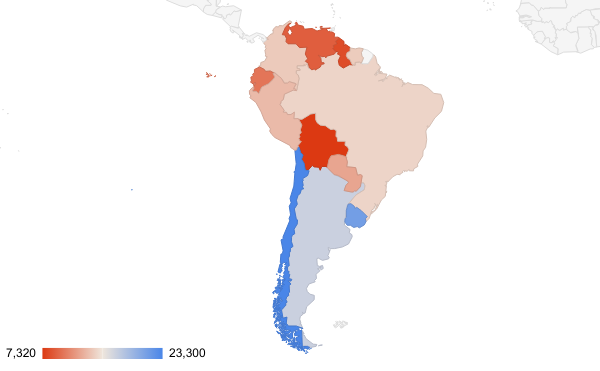
Per Capita GDP - South America Geo Chart
The per capita GDP in Brazil is along the median of the South American countries. Chile, Argentina, and Uruguay have the highest per capita GDP.
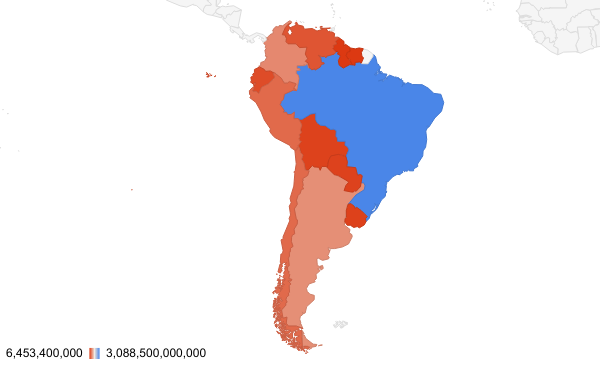
Total GDP - South America Geo Chart
Brazil has the largest economy in South America, which correlates with its population also being the largest.
Related Discussions
Have questions about this video? Start a discussion with the community and Treehouse staff.
Sign upRelated Discussions
Have questions about this video? Start a discussion with the community and Treehouse staff.
Sign up
You need to sign up for Treehouse in order to download course files.
Sign upYou need to sign up for Treehouse in order to set up Workspace
Sign up
