
Data Analysis Bootcamp
Launch Your
Tech Career as a
Data Analyst
Learn how to use data to answer questions, gather actionable insights, and tell a story using spreadsheets, databases, and Python through our self-paced online bootcamp with hands-on projects and expert feedback.
-

9 portfolio-ready projects with 1:1 feedback from experienced developers
-
Beginner-friendly — no coding experience needed to start
-
Graduate job-ready with a verified certificate
 Download Syllabus
$199/mo after 7-day trial • Start immediately • Pause or cancel anytime
Data Analyst Salary Calculator
Calculate your career earnings path based on your current salary.
Program Overview
 3-8 months
 $199/mo
 9 graded projects
 4.8/5 rating
A complete online bootcamp designed for beginners and career changers ready to become data analysts. Learn to use data to answer questions, gather actionable insights, and tell a story.

Skills You'll Master
Python • Data Visualization • SQL • Statistics • Pandas • Excel • Tableau • Data Storytelling

1:1 Live Support
Unlike massive platforms with thousands of students, you get personalized reviews on every project by real developers.

Learn Together
Join peers and staff working together in our private Slack workspace. Get answers fast, exchange peer reviews, build your network.

Real-World Projects
Analyze real datasets, build visualizations, and work with APIs — practical skills employers want.

Practice by Doing
Practice coding through interactive quizzes, code challenges, and fully browser-based Workspaces.

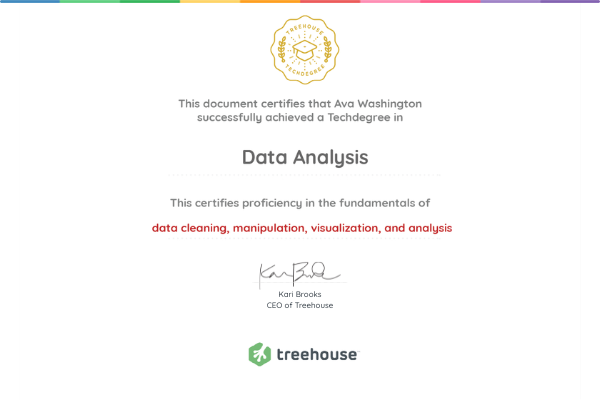
Certification
Earn a verified Accredible certificate to showcase your expertise to recruiters and employers.

Projects You'll Build
Download Complete Syllabus
A Number Guessing Game
Build a console game where players guess a randomly selected number, using Python fundamentals like variables, loops, and conditionals.
A Basketball Stats Tool
Clean up player data and organize basketball players into balanced teams, using Python data types to store, organize, and generate team statistics.

Graduate Job-Ready
When you graduate, you'll have everything employers look for:
-
Verified Accredible certificate — add it to LinkedIn and your resume to stand out
-
Professional portfolio of data analysis projects showcasing your ability to gather insights from real data
Meet Our Graduates

Arjun Salazar
Full Stack Developer

"FSJS was challenging but rewarding. It took me 7 months to complete while I was working full time, but building complete applications from front to back end prepared me perfectly for my current role."

Kalina Edwards
Web Developer

"The value of a Treehouse education has meant everything to me. It has helped me reach another level in my career that has given me a better life and the realization that anything is possible." Read more…

Jessica Williamson
UX Designer

"The UX Techdegree completely changed how I think about design. The projects I built turned into the portfolio that got me my first UX role."

Marcus Rodriguez
Front End Developer

"The Front End Web Development program was exactly what I needed. I went from knowing nothing about coding to landing my first developer job in just 4 months!"

Jim Syphokham
Web Development Director

"Because of Treehouse I have a fulfilling career, dignity and self-respect, a great salary, and the ability to positively impact the lives of my clients and my community. I am now able to provide a great life for the people I love the most." Read more…

Noelle K.
Python Developer
"Treehouse gave me the skills and confidence to transition from retail to becoming a Python developer. The projects were practical and helped me build a strong portfolio."

David Park
Data Analyst
"As a career changer, I got hands-on experience in the Data Analysis Techdegree working with real datasets. I'm now a data analyst and loving every minute of it."

Claire Tregunna
Engagement Manager
"Treehouse has such a variety of learning, and the easy-to-follow videos, challenges, and practices are fantastic. The community is amazing, especially in the Techdegrees." Read more…

Omari Adara
BI Analyst
"I use what I learned at Treehouse every single day. With a business background and limited coding experience, the Techdegree gave me the technical edge to land my first role as an analyst."

Erinn Jacoszek
Product Manager
"The Techdegree didn't just teach me — it transformed me. The mentorship, the practical skills — it all clicked. Now I'm in a product manager role I love."
TECHDEGREE GRADUATES ARE SUCCEEDING AT THESE TOP COMPANIES


Data Analyst Bootcamp: Faster & More Affordable
Compare your path to becoming a Data Analyst
The best of both worlds! Structured curriculum + personalized 1:1 support + professional credentials — at 1.5% the cost of college.

Still not sure which path is right for you?
Answer a few quick questions and we'll recommend the perfect learning path for you.

Frequently Asked Questions
Everything you need to know before you start
No! Our Techdegree programs are designed for complete beginners. You'll start with the basics and build your skills through hands-on projects. Our student success team is available via Slack and Zoom whenever you need help.
Most students finish in 3-8 months, depending on their schedule. If you dedicate 10-15 hours per week, expect to complete in about 5 months. The program is self-paced with no time limit—learn at your own speed.
The Techdegree programs are 100% online. You can learn from anywhere with an internet connection, on your own schedule. All courses are accessible 24/7.
We strongly recommend holding off on using AI in your projects so that you build the foundational skills needed. The final unit and project of each Techdegree is an AI unit, where you'll learn how to use AI tools to help you code better, and you'll get the opportunity to build a final project using AI.
Yes, you'll need to pass a final exam to earn your Techdegree certificate. The exam tests your understanding of the core concepts you've learned throughout the program. Don't worry—by the time you complete all the projects and coursework, you'll be well-prepared. If you don't pass on the first attempt, you can retake the exam.
$199/month with no contracts. Start with a free 7-day trial to explore the full curriculum before committing. Pause or cancel anytime.
Full access to all lessons, projects, coding challenges, Slack community, and expert code reviews. Start building immediately.
Yes! You can pause your Treehouse subscription at any time. When you're ready to resume, your progress will be saved exactly where you left off.
Real-time help via Slack and Zoom, detailed code reviews on every project from experienced developers, and a community of fellow students. You're never learning alone.
Absolutely! Most students work full-time. The self-paced format lets you learn on nights and weekends. We recommend 10+ hours per week to stay on track.
Yes. You'll build a portfolio of real data analysis projects that you can show to hiring managers, you'll earn an Accredible certificate you can post on LinkedIn, and you'll master the skills employers seek.
A verified Accredible certificate for LinkedIn and your resume, plus a complete portfolio of finished data analysis projects showcasing your skills to potential employers.
Today! No cohorts or enrollment periods. Sign up for your free trial and begin learning immediately.
Launch your tech career today
Join thousands of students who have transformed their careers with a Treehouse Techdegree. Start learning today with our 7-day free trial.
Start Free Trial-
$199/mo after trial
-
Cancel anytime
-
Start immediately