Welcome to the Treehouse Community
Want to collaborate on code errors? Have bugs you need feedback on? Looking for an extra set of eyes on your latest project? Get support with fellow developers, designers, and programmers of all backgrounds and skill levels here with the Treehouse Community! While you're at it, check out some resources Treehouse students have shared here.
Looking to learn something new?
Treehouse offers a seven day free trial for new students. Get access to thousands of hours of content and join thousands of Treehouse students and alumni in the community today.
Start your free trial
Bernardo Augusto García Loaiza
Courses Plus Student 792 PointsPutting the standard deviation in graph
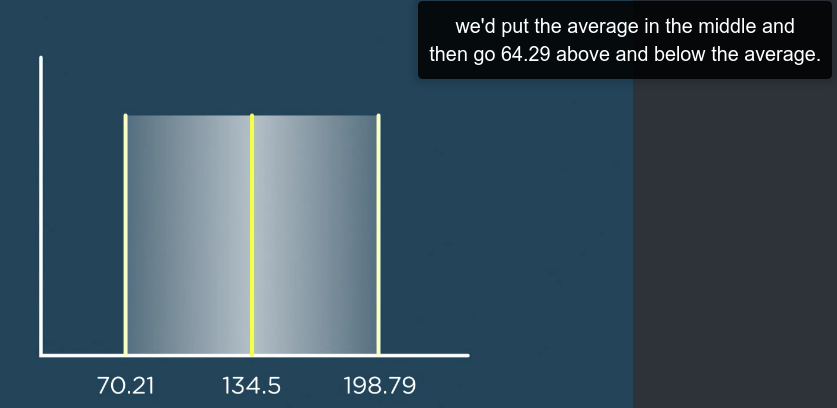
Hi, in the video in the 00:49 , talk about of put in one graph the standard deviation, the average in the middle ... but in the graph is 70.21, in one extreme and 198.79 in another extreme...
How to are generate these two values? Here the illustration https://cldup.com/MeVsHBwHMr.png