Heads up! To view this whole video, sign in with your Courses account or enroll in your free 7-day trial. Sign In Enroll
Well done!
You have completed Data Visualization with Google Sheets!
You have completed Data Visualization with Google Sheets!
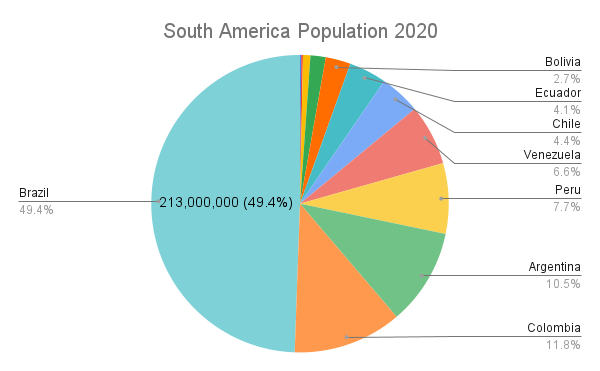
A pie chart is a circular data visualization divided into segments, used to represent parts of a whole. Each section of the circle represents a value that is a percentage.
South America Population 2020
Brazil composes almost half of the total population of South America. There are 213 million people living in Brazil.
Related Discussions
Have questions about this video? Start a discussion with the community and Treehouse staff.
Sign upRelated Discussions
Have questions about this video? Start a discussion with the community and Treehouse staff.
Sign up
You need to sign up for Treehouse in order to download course files.
Sign upYou need to sign up for Treehouse in order to set up Workspace
Sign up