This workshop will be retired on May 1, 2025.
Heads up! To view this whole video, sign in with your Courses Plus account or enroll in your free 7-day trial. Sign In Enroll
Preview
Video Player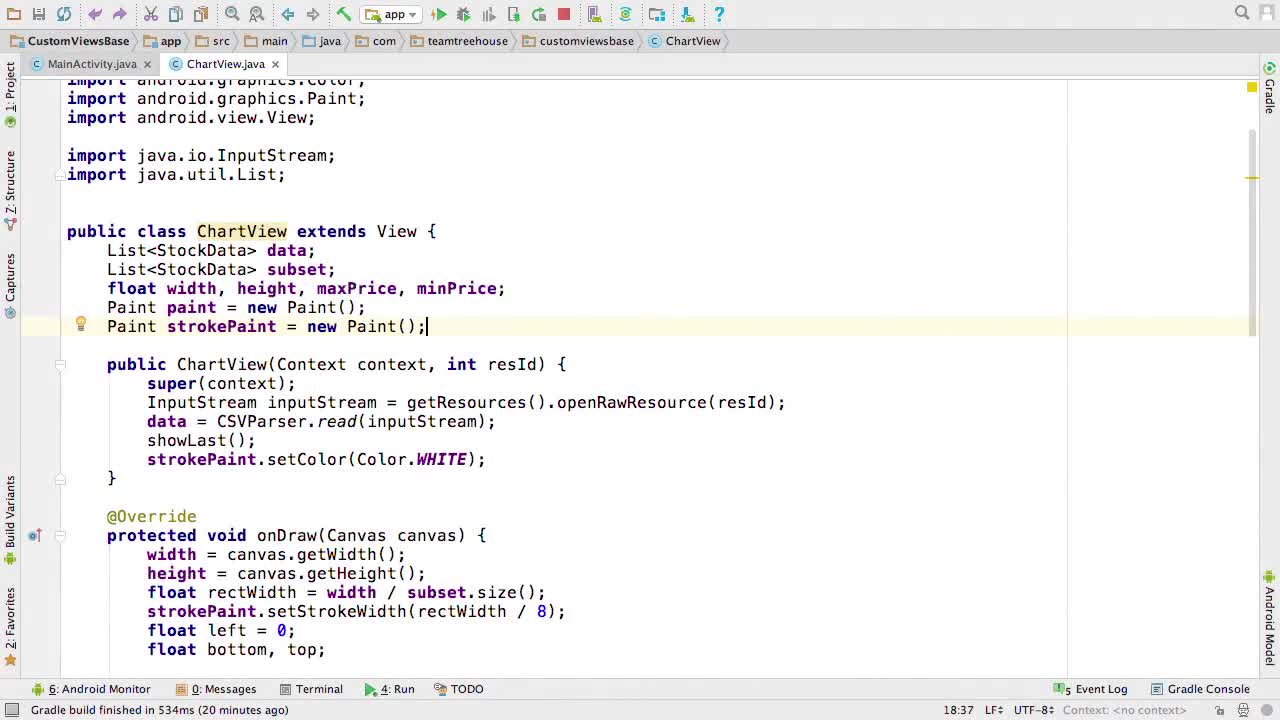
00:00
00:00
00:00
- 2x 2x
- 1.75x 1.75x
- 1.5x 1.5x
- 1.25x 1.25x
- 1.1x 1.1x
- 1x 1x
- 0.75x 0.75x
- 0.5x 0.5x
In this video we'll add labels to our chart to give us a better idea of what's going on!
This video doesn't have any notes.
Related Discussions
Have questions about this video? Start a discussion with the community and Treehouse staff.
Sign upRelated Discussions
Have questions about this video? Start a discussion with the community and Treehouse staff.
Sign up
We just finished turning our boring stock
chart into an exciting candlestick chart.
0:00
But without knowing what prices these are,
it's not a very useful chart.
0:04
So let's add a few labels
to give us some price info.
0:08
Let's start at the top of the class by
creating a new paint object for our text.
0:12
And let's name it textPaint.
0:16
So Ctrl or Cmd + D to duplicate this.
0:18
And then name it textPaint.
0:21
Then, inside the constructor we need
to set a few properties of our new
0:24
paint object.
0:27
The first property we
need to set is the color.
0:29
So let's type textPaint.setColor
then pass in Color.WHITE.
0:31
The next property we need
to set is the text size.
0:39
We can do that with
the setTextSize function.
0:42
So textPaint.setTextSize and
0:44
let's pass in 40f to make our
text about 40 pixels tall.
0:47
Finally, since we want our labels to
go on the right side of the screen,
0:53
we need to have our text be right aligned.
0:57
To do this,
we can call textPaint.setTextAlign and
0:59
pass in Paint.Align.RIGHT.
1:07
And now that we've got our textPaint,
1:11
all that's left is to use
it to draw our labels.
1:13
Inside the onDraw function, below our for
loop where we draw our candlesticks.
1:16
Let's add another loop to loop
from the minPrice to the maxPrice.
1:23
for (int i =, and we'll have to
1:28
cast this as an int, minPrice.
1:32
While i is less than maxPrice, i++.
1:36
Then, inside this loop, let's add a line
and label for every $20 increment.
1:46
Let's start by checking if
i divides evenly into 20.
1:52
We can do this by saying if (i %20 == 0).
1:55
And if it is then we'll draw our label and
add a horizontal line.
2:02
Starting with the horizontal line
let's type canvas.drawLine and
2:07
pass in 0 for the starting x.
2:13
getYPosition of i for the starting y.
2:17
Then width for the stopX and
2:22
getYPosition of i again for the stopY.
2:25
And finally strokePaint for the paint.
2:29
Also we don't want these lines to be
quite as wide as our candle lines.
2:34
So let's add a line above this one and
call strokePaint.setStrokeWidth.
2:38
And only make this one pixel wide, nice.
2:45
Last but not least,
we just need to draw our text.
2:50
Let's add a line below
where we draw our line.
2:53
Ad then call canvas.drawText.
2:55
And then let's pass in our text as i +
an empty string to cast it to a string.
3:00
And then let's pass in width for
the x value.
3:07
And getYPosition of i for the Y value.
3:11
And then our textPaint for the paint.
3:17
Then let's run the app.
3:21
And there are our labels, but
it doesn't look that good.
3:27
Our labels are covering
up part of the chart.
3:30
And also it'd be nice if the labels
were centered on their lines,
3:32
instead of being above them.
3:36
Back in the code, let's first fix the
issue of our labels covering up the chart.
3:38
To do this, we're just going to
make our chart a little less wide.
3:43
Inside the onDraw method above where we
set rectWidth let's create a new float
3:47
named chartWidth.
3:52
And let's set that equal to width,
minus the size of our text.
3:57
Which we can find by using
textPaint.measureText and
4:01
passing in the text we'd like to measure.
4:05
Let's go with 1000 as a string to make
sure we have enough room for the price.
4:09
Once we've got our chartWidth variable
we just need to update rectWidth to
4:15
use it instead of our width.
4:18
Also we should update our horizontal
lines to use chartWidth as well.
4:26
So here we should change
width to chartWidth, awesome.
4:32
Now that we've made some space for
our text.
4:36
Let's also lower it a bit to make each
label match up with its own line.
4:38
To do this we just need to add half
of the text's height to its Y value.
4:43
Unfortunately to get the text height,
we first need to get a textBounds object.
4:47
So up at the top of the class
let's add two new fields.
4:52
One float for our textHeight and
one Rect which we'll need to import.
4:57
And we'll call it textBounds.
5:02
And we also need to initialize it.
5:07
So let's set it equal to a new Rect.
5:09
Then at the bottom of our constructor
after our textPaint has been set up.
5:11
Let's call textPaint.getTexBounds.
5:17
This function takes in a string, and
a start and end point of that string.
5:21
It also takes in a rectangle which updates
to be a bounding box around our string
5:26
from start to end.
5:31
Since we're only concerned
with the height of our text.
5:32
Let's just pass in 0 as a string for
the text and then 0 and
5:35
1 for the start and end and
also our textBounds.
5:41
Then on the next line let's set
5:47
textHeight = textBounds.height.
5:51
Finally back on the bottom of onDraw,
let's add,
5:56
textHeight / 2 to the y value of our text.
6:02
Then let's run the app and
see if we got it.
6:07
Nice, great job!
6:13
Those are some awesome
looking candlesticks.
6:16
Coming up,
we'll see how we can modify our code and
6:18
add our chart view in XML
instead of in MainActivity.
6:21
You need to sign up for Treehouse in order to download course files.
Sign upYou need to sign up for Treehouse in order to set up Workspace
Sign up