This workshop will be retired on May 1, 2025.
Heads up! To view this whole video, sign in with your Courses Plus account or enroll in your free 7-day trial. Sign In Enroll
Preview
Video Player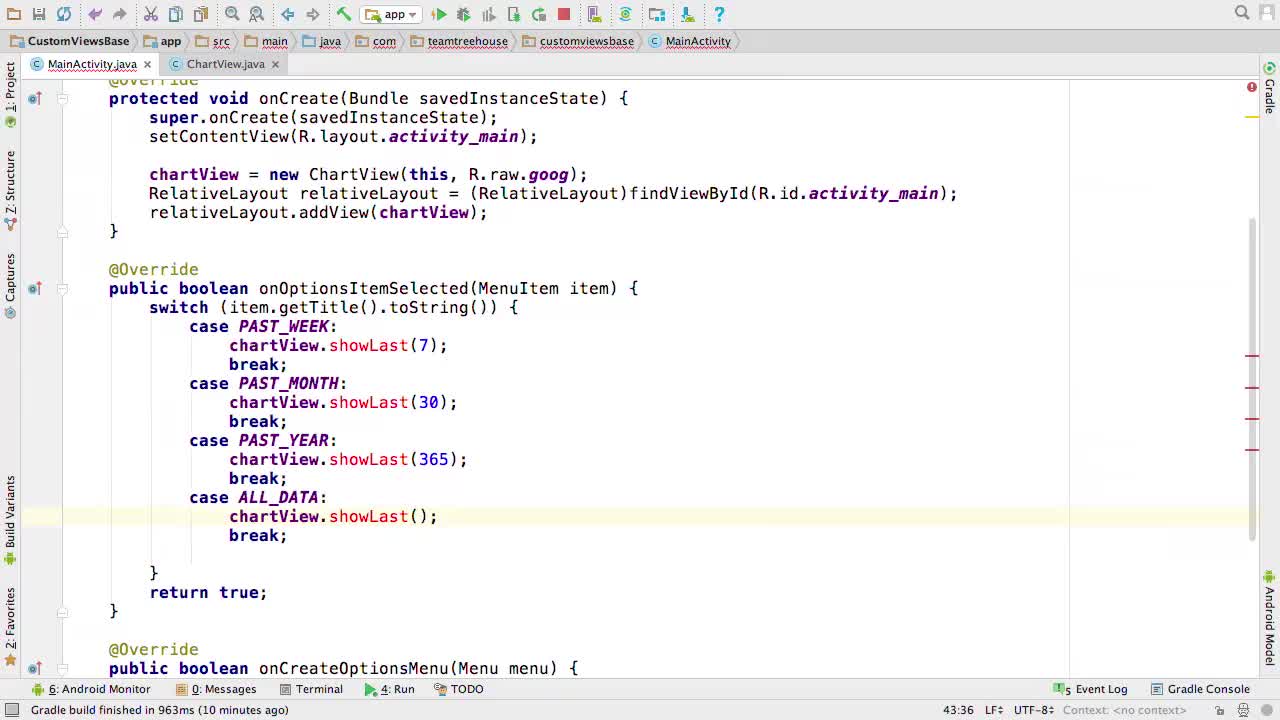
00:00
00:00
00:00
- 2x 2x
- 1.75x 1.75x
- 1.5x 1.5x
- 1.25x 1.25x
- 1.1x 1.1x
- 1x 1x
- 0.75x 0.75x
- 0.5x 0.5x
In this video we'll see how we can show less of our data and refresh our custom View!
Related Links
Related Discussions
Have questions about this video? Start a discussion with the community and Treehouse staff.
Sign upRelated Discussions
Have questions about this video? Start a discussion with the community and Treehouse staff.
Sign up
We just finished setting up our
menu to give users a choice in
0:00
how much data they'd like to see.
0:03
But while the menu is there,
the functionality isn't.
0:05
We still need to create
the showLast function.
0:08
So let's use Alt+Enter to create it.
0:10
And I'm going to change
the variable name to n.
0:16
Now that we've got our showLast function,
we just need to make it work.
0:19
Which means in the onDraw function,
instead of drawing all of our data,
0:23
we need to be able to
draw just a subset of it.
0:27
Let's start by creating a new field
to hold a subset of our data.
0:30
Let's use Cmd or
Ctrl+D to duplicate our data line, and
0:34
then just change the name to subset.
0:37
Then inside onDraw, let's use the subset
of our data instead of all the data.
0:43
So let's replace data with subset,
data with subset, and data with subset.
0:49
Finally, in the constructor,
0:55
let's initialize our subset
to be equal to our data.
0:57
Subset equals data.
1:00
Nice.
1:05
Now that we're using a subset of
our data instead of all the data,
1:07
we just need to update the subset and
the showLast function.
1:10
So inside the showLast function,
1:14
let's just set subset
equal to data.subList(0,
1:18
n), and there we go.
1:25
All that's left is implementing the zero
parameter version for the all data option.
1:28
So let's just copy and
paste our showLast function.
1:33
And then remove the parameter.
1:39
Then inside this function,
let's just call the other
1:42
showLast function while
passing in data.size for n.
1:47
Awesome, now let's run the app and
see what happens.
1:53
We've got our chart, and
we've got our options.
1:57
And if we click on one, nothing happens.
2:01
But don't worry, I know what we did wrong.
2:05
As it turns out,
drawing is kind of an expensive operation.
2:07
An Android does its best to
avoid any unnecessary drawing.
2:11
So whenever you make a change
to one of your views,
2:15
we need to tell Android about it, which
we do by using the invalidate method.
2:17
Calling invalidate on a view signals to
Android that this view is no longer valid
2:22
and needs to be redrawn.
2:27
Also, along with invalidate,
2:29
you should probably know about
the request layout function.
2:31
If you change the size of view, you
want to use the request layout function.
2:34
And if you change both
the content of the view and
2:38
the size, then you'll need to call
both invalidate and request layout.
2:40
So at the bottom of our original showLast
function, let's add a call to invalidate.
2:45
And if we run the app again.
2:51
And then pick one of the options.
2:54
Perfect!
2:58
Instead of all the data,
we've just got the past year.
2:59
And if we click through the rest of these
options, it looks like they all work.
3:02
Though, since we aren't changing
any of the y coordinates for
3:07
something like past week,
it pretty much just looks like a line.
3:10
We'll fix that in the next video.
3:14
You need to sign up for Treehouse in order to download course files.
Sign upYou need to sign up for Treehouse in order to set up Workspace
Sign up