Preview
Line Charts
6:16A line chart is made up of a series of data points connected by straight lines. Usually, they show trends of values over time.
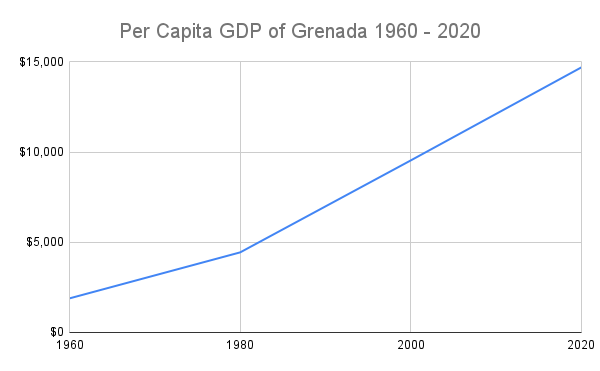
Per Capita GDP of Grenada 1960 - 2020
In 1960, the per capita GDP in Grenada was just less than $2,000. Between the years 1980 and 2020, the per capita GDP tripled from around $5,000 to around $15,000.
Related Discussions
Have questions about this video? Start a discussion with the community and Treehouse staff.
Sign upRelated Discussions
Have questions about this video? Start a discussion with the community and Treehouse staff.
Sign up
A line chart shows trends
in values over time.
0:00
A line chart is made up of a series of
data points connected by straight lines.
0:05
Typical examples of a line chart
are economic data, such as stock prices, and
0:11
health monitoring data, such as heart rate.
0:16
In our Caribbean dataset, we have plenty
of data to make line charts from.
0:19
I'll pick one country, Grenada.
0:25
How did the GDP per capita
change in the last 60 years?
0:28
First, I can click and drag all of
the years I need from 1960 to 2020.
0:33
Then, to select the GDP per capita,
I will need to hold Command on Mac, or
0:41
Ctrl on PC, while clicking and dragging.
0:46
I inserted a chart from the menu
bar in the last video, but
0:53
there's also a chart icon in the toolbar.
0:57
You may have to expand the toolbar by
clicking on the three dots in the top
1:00
right corner.
1:04
So, I'll click on that to insert a chart,
1:07
and the default chart it
gave me is a line chart.
1:13
If your chart is different than mine,
go to your Chart Editor setup,
1:16
click on the Chart Type dropdown, and
scroll down to select Line Chart.
1:21
The first thing I like to do with my
charts is to make sure that they have
1:33
a good descriptive title.
1:37
So there's no title by
default on our chart.
1:39
Let's add one.
1:42
In the Chart Editor menu,
go to the Customize tab,
1:44
and select Chart & axis titles.
1:51
Make sure that the dropdown for
1:53
title type selector says Chart title.
1:57
For our Title text, let's name it
Per Capita GDP of Grenada 1960-2020.
2:02
And let's center the title, too.
2:25
In a line chart,
2:29
values are represented by the points
where the lines cross the vertical axis.
2:30
We can also customize the point size
to make it more obvious where exactly
2:36
this is.
2:41
Double click on the line
of the line chart, and
2:42
this opens the Series option
in the chart editor. Here,
2:46
notice how the default for
point size says None.
2:51
Let's change that to 7 pixels,
2:55
and while we're here, there
are options to change the line color,
2:57
opacity, dash type, line thickness,
and even the shape of the points.
3:04
I'll leave mine as it is, but feel free to
play around with your own customizations.
3:11
Keep in mind that the goal is to have
a chart that is clearly readable.
3:18
Now I can make an initial observation.
3:25
In 1960, the per capita GDP of
Grenada was less than $2,000.
3:28
Then from 1980 to 2020,
the GDP had nearly tripled
3:34
from around $5,000 to almost $15,000.
3:39
I can provide more information so
3:44
that a reader can understand how exactly
the value has changed over time.
3:46
We can insert some labels
into our line chart.
3:52
In the Chart Editor
under the Customize tab,
3:55
I'll scroll down just a little bit
to find a series of checkboxes.
3:57
The one that I'm looking for
is Data labels.
4:02
Let's click that.
4:06
And I have three labels, but I'm missing
one due to the default formatting.
4:12
So let's reformat it.
4:18
I'll change the position
from Auto to Below.
4:21
Now, I have all four of my data points
clearly labeled on my line chart.
4:26
That's a nice chart.
4:31
Now let's add some alternative text.
4:32
Open the menu dropdown on our chart
4:37
and click Alt text.
4:39
We can copy over our chart's
descriptive title for
4:45
the Alt text title,
Per Capita GDP of Grenada 1960-2020.
4:50
For a description, let's use our add
a glance observation that we made earlier.
4:55
In 1960, the per capita GDP in
Grenada was just less than $2,000.
5:03
Between the years 1980 and 2020,
5:09
the per capita GDP tripled from
around $5,000 to around $15,000.
5:12
You can copy and paste these
descriptions from my Teacher's Notes,
5:17
and I think this will pass the phone test
that is to say, if I read this to someone
5:21
over the phone, they would understand
the trend of the line chart.
5:26
Now it's your turn to practice.
5:31
Make one or several line charts for
another Caribbean country.
5:33
Remember to include alternative text.
5:38
Before we get started with our next plot,
5:40
we need to move this line chart
out of the way to its own sheet.
5:42
Click on the chart's Options menu and
move it to its own sheet.
5:48
And let's rename the sheet
with a descriptive title, so
5:55
we know where to find it.
5:58
I'll call it Grenada GDP Line Chart.
6:02
If you made several line charts,
go ahead and
6:08
move each one of them to a new sheet and
rename the sheets, descriptively.
6:10